
Scientific Storytelling on a Recent COVID-19 Paper
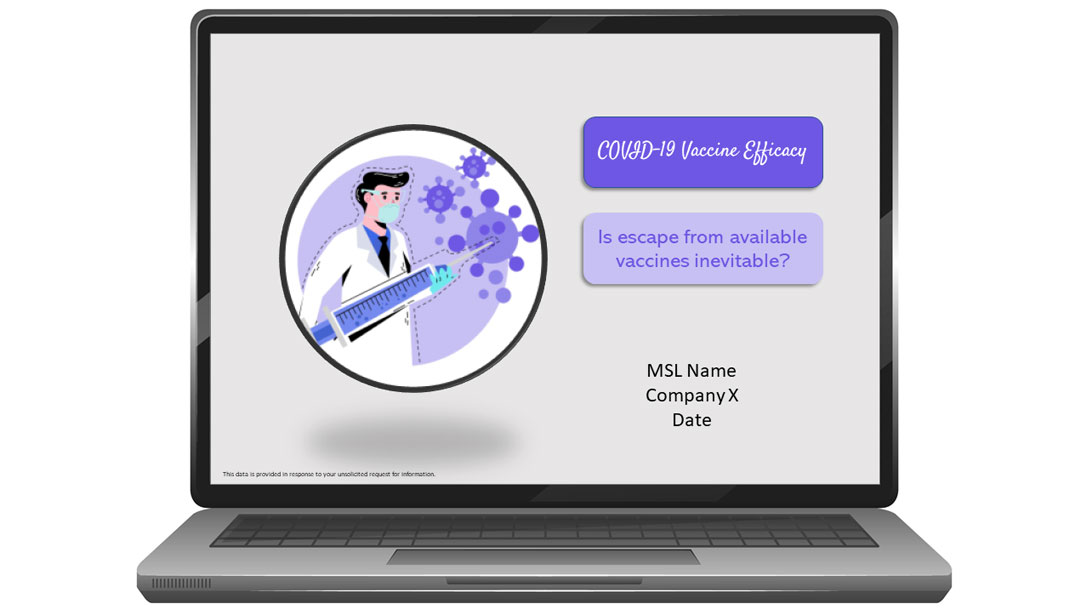
Overall Training Challenge: Medical Affairs teams need to be able to react quickly when new journal articles are published. The quick turnaround is especially important for new data about the disease...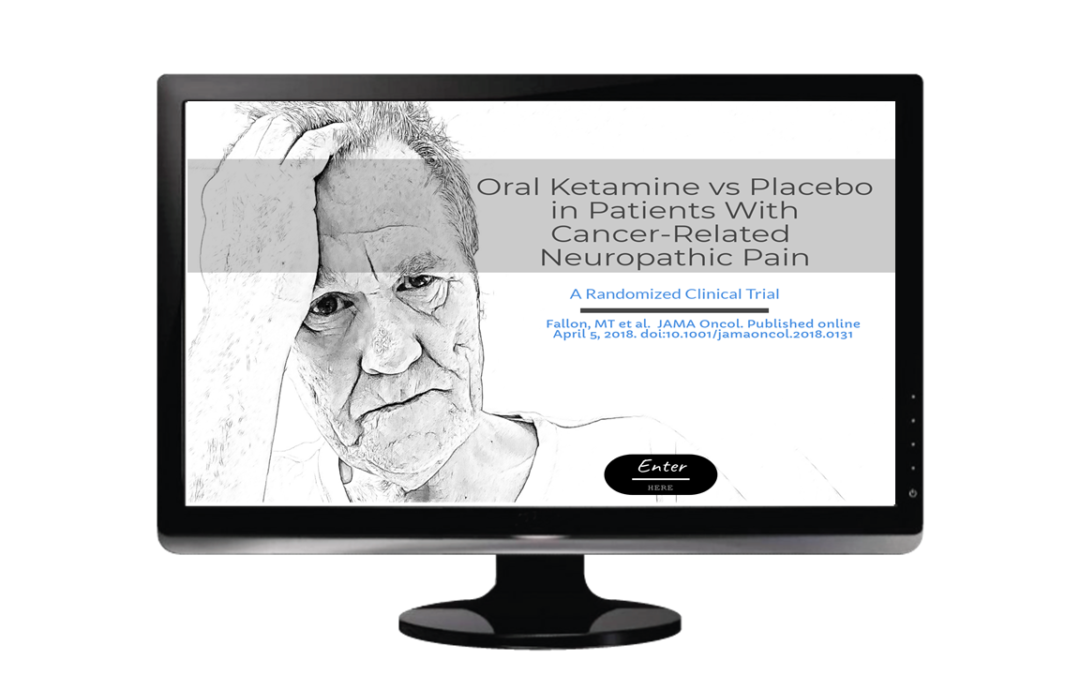
Clinical Trial Review
Your Medical Affairs team needs to stay up to date on new clinical data. However, journal articles condensed into a bare narrative are not likely to interest a large audience – internal or external! For learner motivation and engagement, take data out of dense data tables to make it more accessible and remember that science is made for storytelling! Clinical data cannot tell a story if it is locked in a 10×10 table of other numbers and measurements.
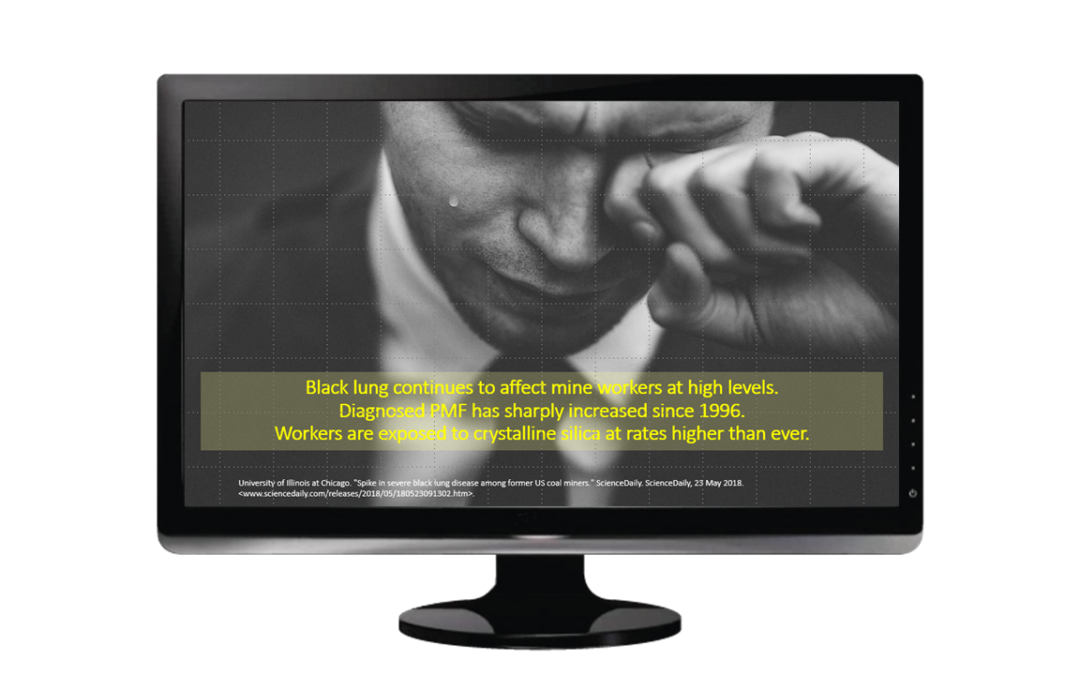
Conference Abstract
Situation: Researchers presented a new study at the 2018 American Thoracic Society medical conference. The conference abstract supported a poster, but there was not a podium presentation. The poster reviewed coal miner’s claims for federal black lung benefits since...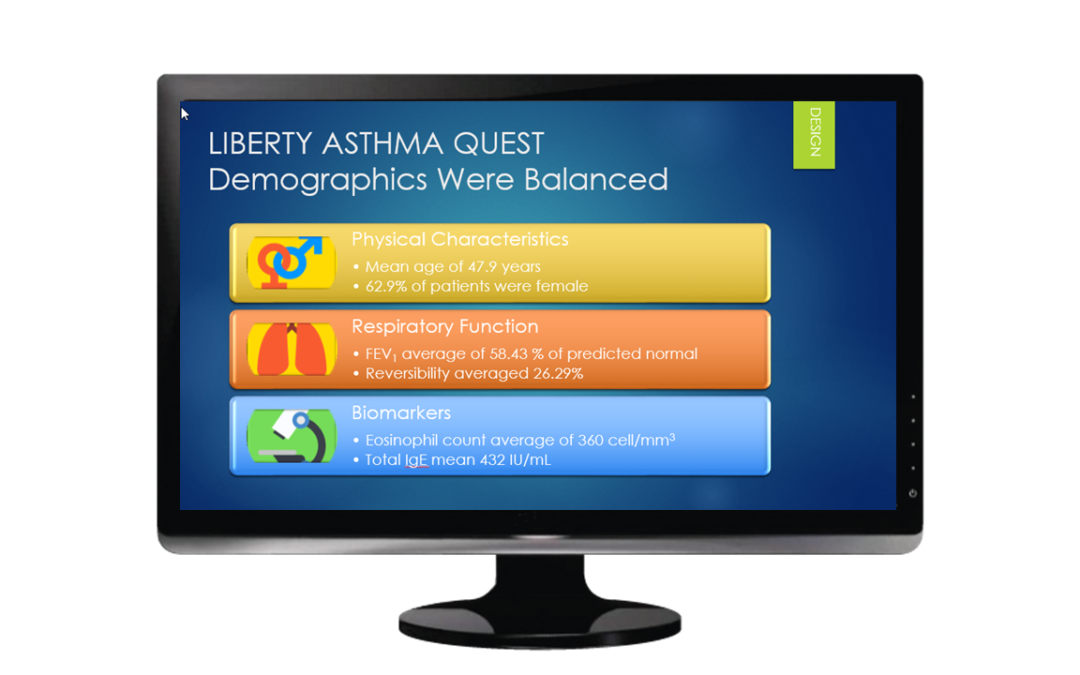
Clinical Data Explained
This client needed clinical data content that was shown in a compelling and visually appealing manner.