
Strategies for visualizing and communicating data to a journal’s target audience.
Overall Challenge:
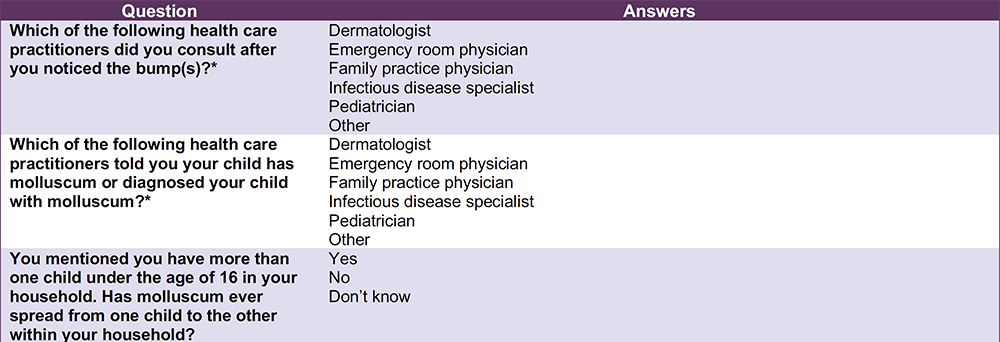
The client tasked us with creating tables and figures for a manuscript slated for submission to a high-impact, peer-reviewed scientific journal. The data were derived from a written survey administered to physicians and caregivers of patients with molluscum contagiosum, a viral skin infection that primarily affects children. The survey was lengthy and composed entirely of text. Below are three representative questions from the survey.1
Solutions
In collaboration with the publication’s authors, we first identified what data were most important to include in the manuscript. Word count and table/figure limitations as set by each journal mean that only the most critical information and data for that journal’s audience – in this case dermatologists – can be presented in the manuscript.
Next, we had to determine the most effective format(s) to visualize and communicate key data points. The objective of tables and figures in a manuscript is always to convey the critical, and sometimes complicated, data in a format that is comprehensible and accurately represents the results.
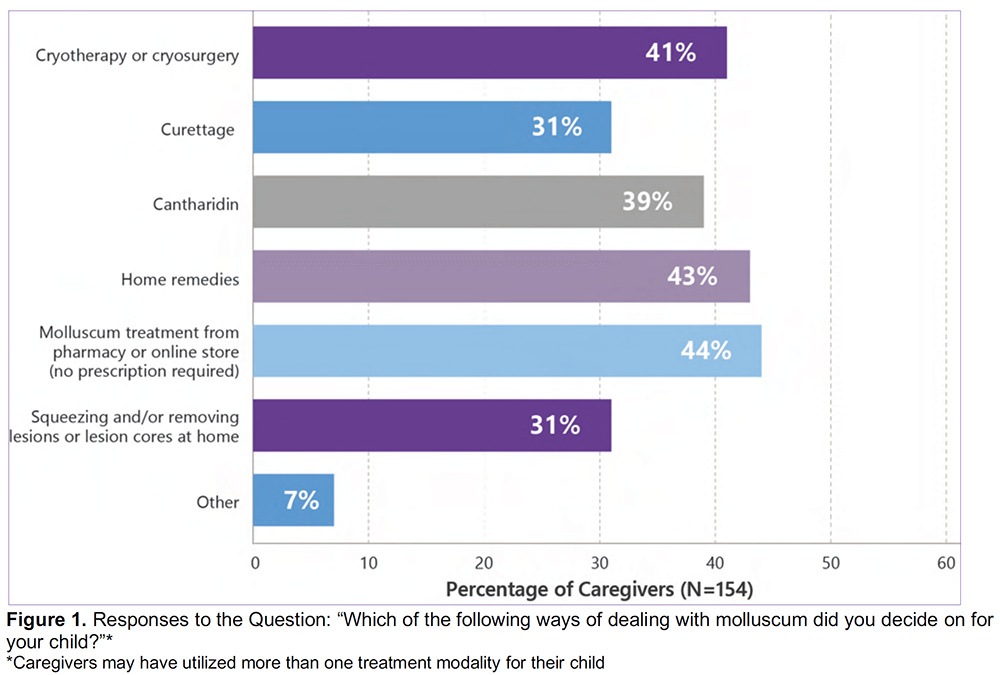
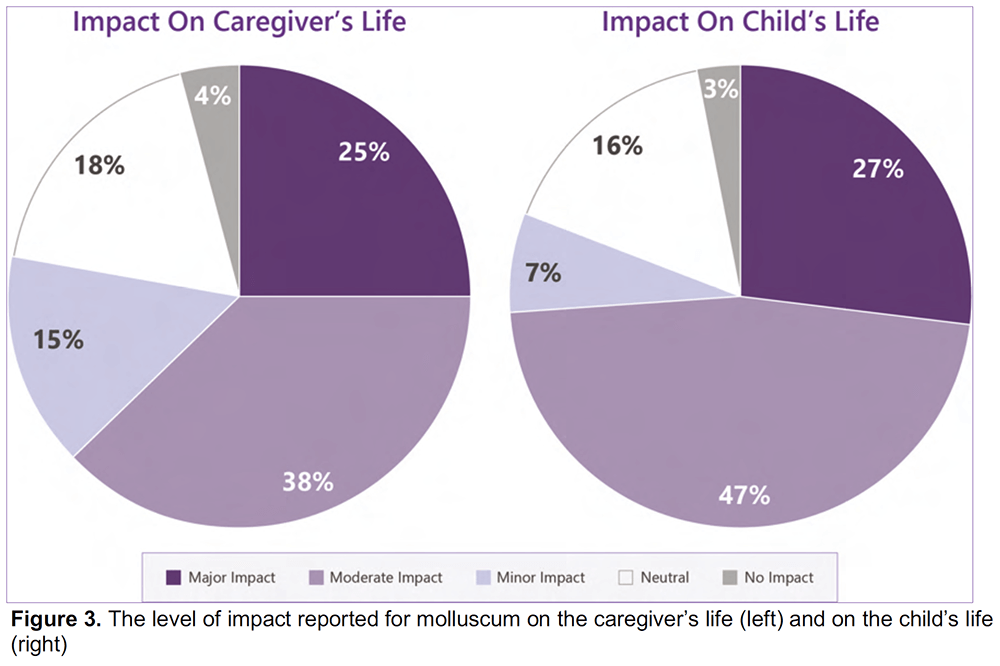
For some of the survey questions, bar charts most clearly communicated the survey’s results. For other questions, pie charts were the better format for conveying the information.
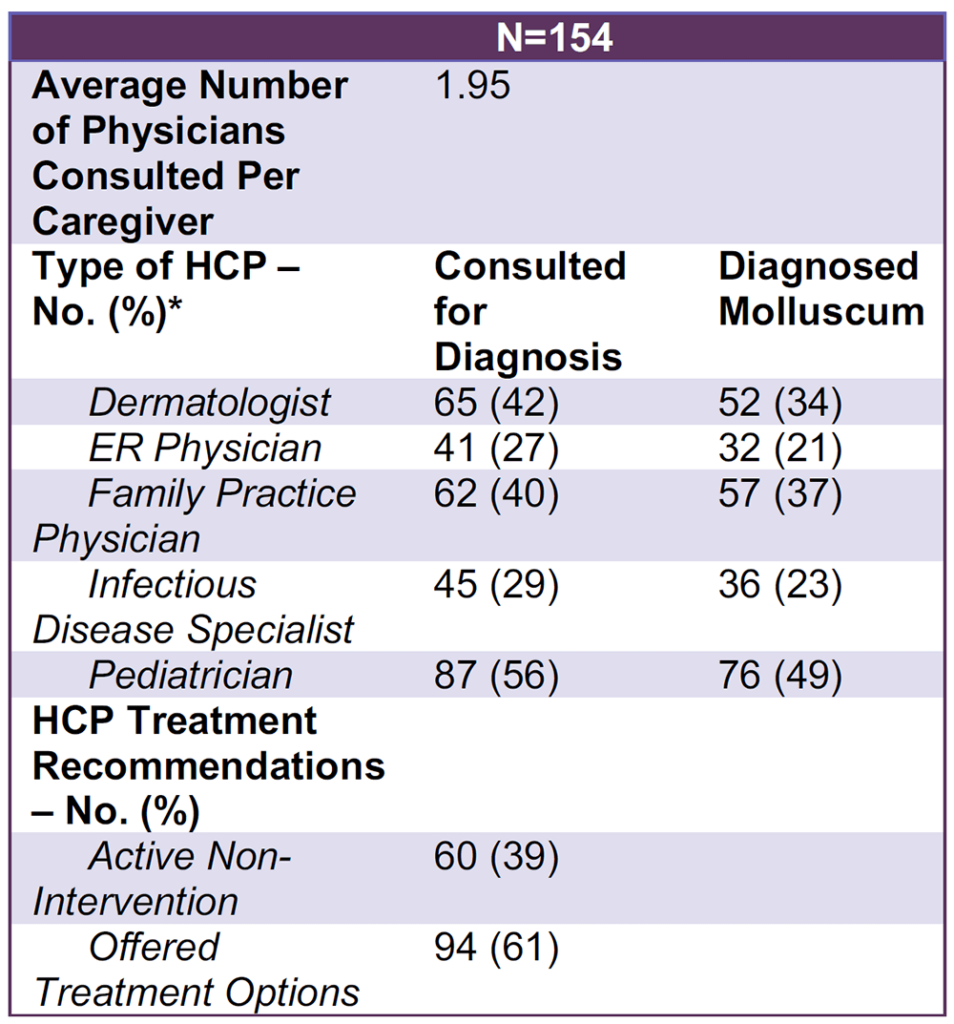
And finally, there were data that were best presented in table format, such as the demographics of the caregivers and physicians interviewed for the survey.
Skills
This project required multiple skill types from Versant. The medical writer, a PhD with experience in publications and data visualization, participated in the discussions to identify the data and formats for the figures and tables. The graphic designer created the graphics and provided the files in the multiple formats and resolutions specified by the journal. And finally, the editor reviewed the content for numerical accuracy, formatting standards, and accurate representation of the survey results.
Contact Us For Your Presentation Needs
If you would like to discuss your data visualization needs, be it a conference poster, manuscript figures, or scientific slide presentation, please contact us.
References
- Kwong, Pearl, et al. “The Hidden Impact of Molluscum Contagiosum: A Survey of Caregivers’ Experiences with Diagnosis, Treatment, and Impact on Quality of Life.” SKIN The Journal of Cutaneous Medicine 5.4 (2021): 363-371. Article accessed on August 2, 2021 at https://jofskin.org/index.php/skin/article/view/1216/pdf.