Situation:
When discussing new scientific data, it is comfortable to get focused on the specifics. Percentages. Spread. p-values. However, your audience needs to understand where to look and why that specific information is key.
Customer:
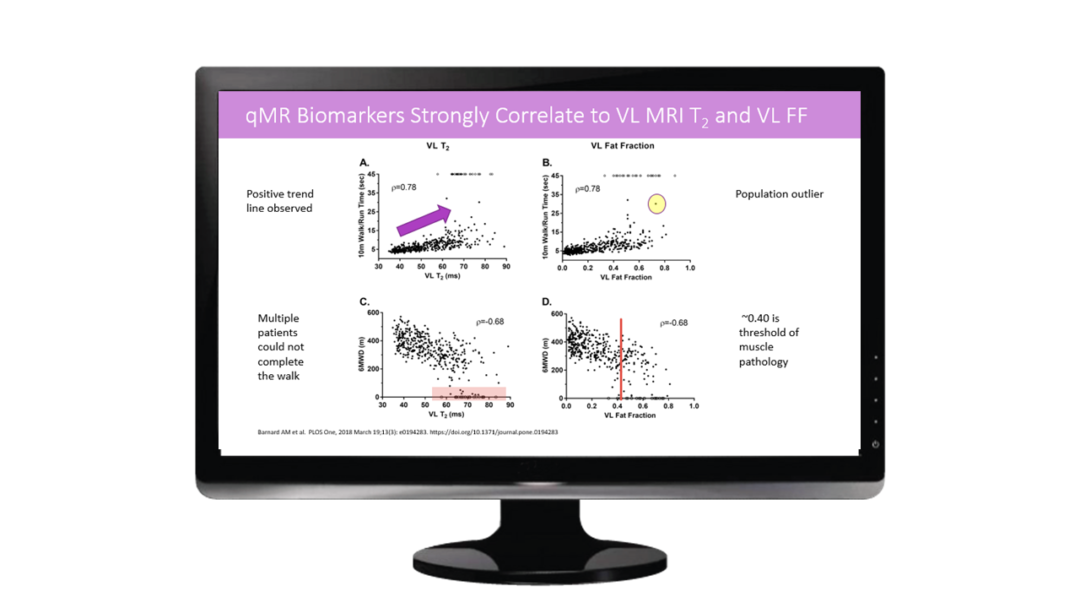
Brought a series of decks created by their team members over a series of years. The decks lacked consistently and the key features of basic science data were unclear.
Request:
Create a slide deck(s) that identified key elements of the data. Highlight critical data elements for team members. Discuss why certain data points would be beneficial to share with KOLs.
Outcomes:
- Streamlined slide deck
- Data shared as a story to keep listener interest
- Data support documents for team review before an interaction
- Key data elements were highlighted with the author’s conclusions
- Built with natural points to stop for discussion with an audience
Value:
The team has a deck that they can easily deploy in the field for feedback. Data is ‘annotated’ in the deck which provides a point for discussion with healthcare providers.

