by Jessica McLin | Aug 10, 2021
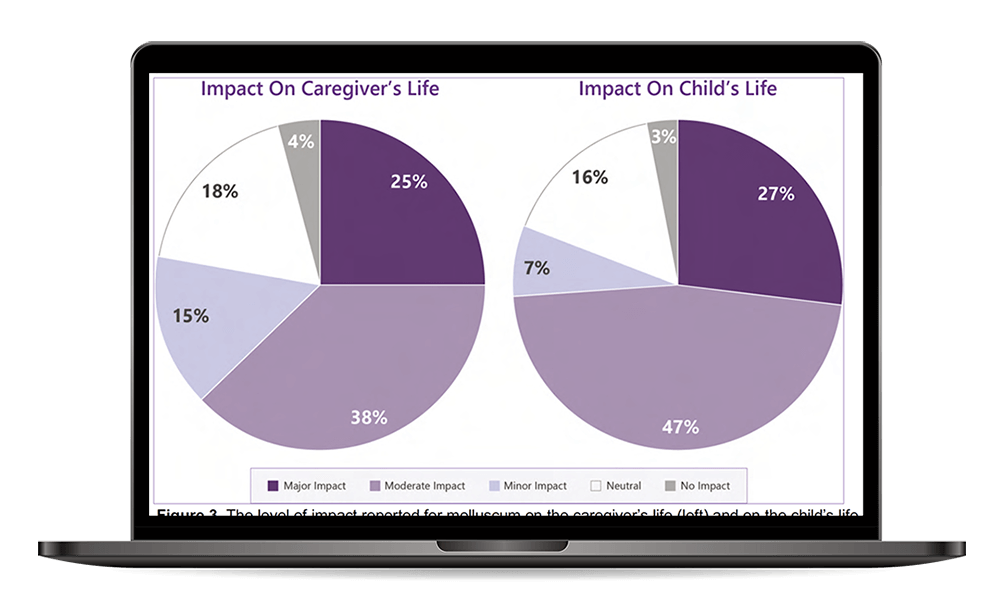
Strategies for visualizing and communicating data to a journal’s target audience. Overall Challenge: The client tasked us with creating tables and figures for a manuscript slated for submission to a high-impact, peer-reviewed scientific journal. The data were derived...

by Melody Davis | Jul 30, 2018
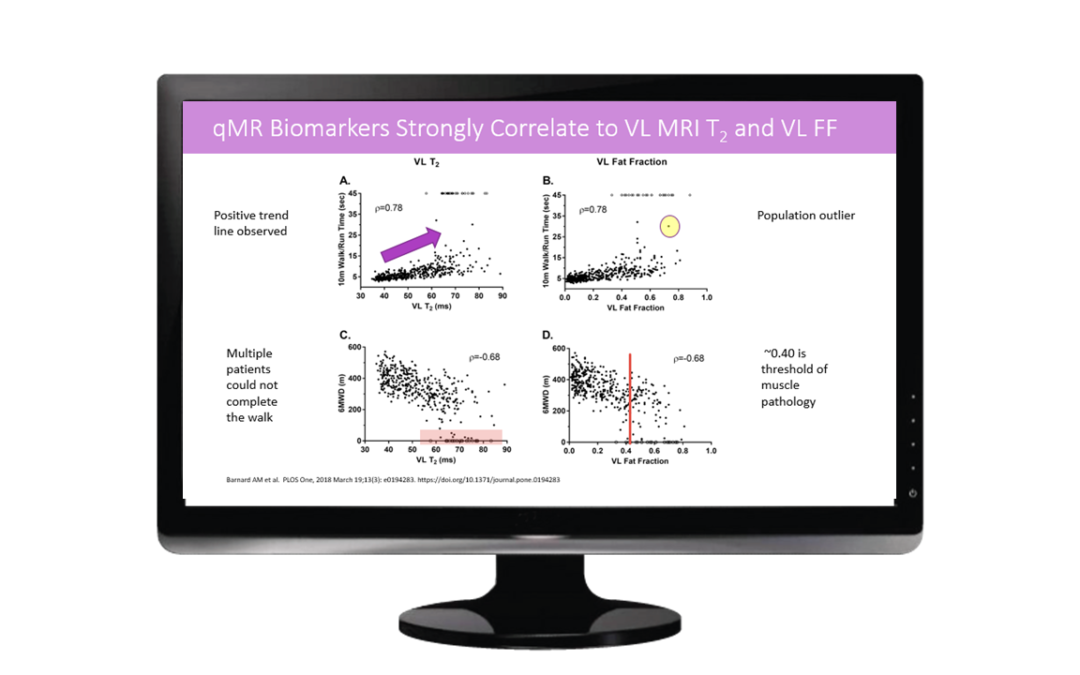
Situation: When discussing new scientific data, it is comfortable to get focused on the specifics. Percentages. Spread. p-values. However, your audience needs to understand where to look and why that specific information is key. Customer: Brought a series of decks...


