by Jessica McLin | Aug 10, 2021
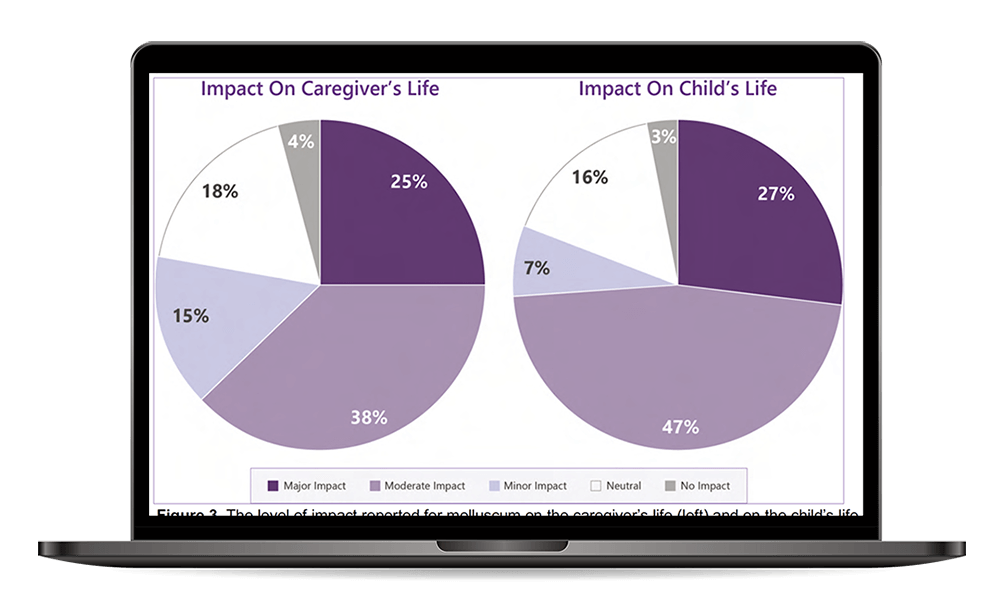
Strategies for visualizing and communicating data to a journal’s target audience. Overall Challenge: The client tasked us with creating tables and figures for a manuscript slated for submission to a high-impact, peer-reviewed scientific journal. The data were derived...

by Melody Davis | Apr 26, 2020
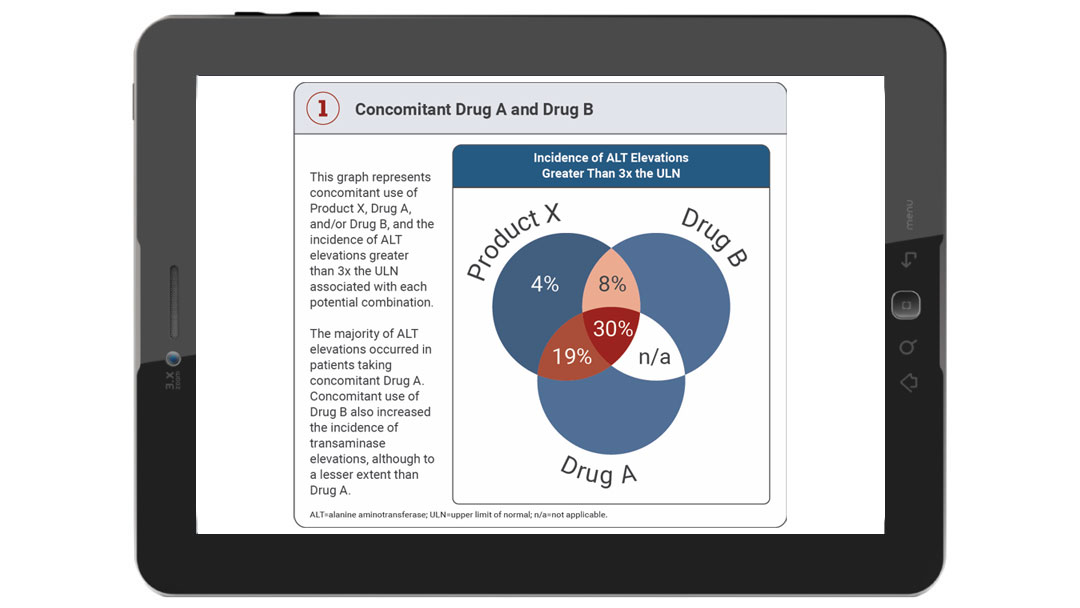
Overall Training Challenge: Medical Information departments from 2 pharmaceutical companies (one large and one small) wanted to update their current “walls-of-text” standard response letters (SRLs) to look and function more like infographics. Because SRLs require a...

by Melody Davis | Apr 26, 2020
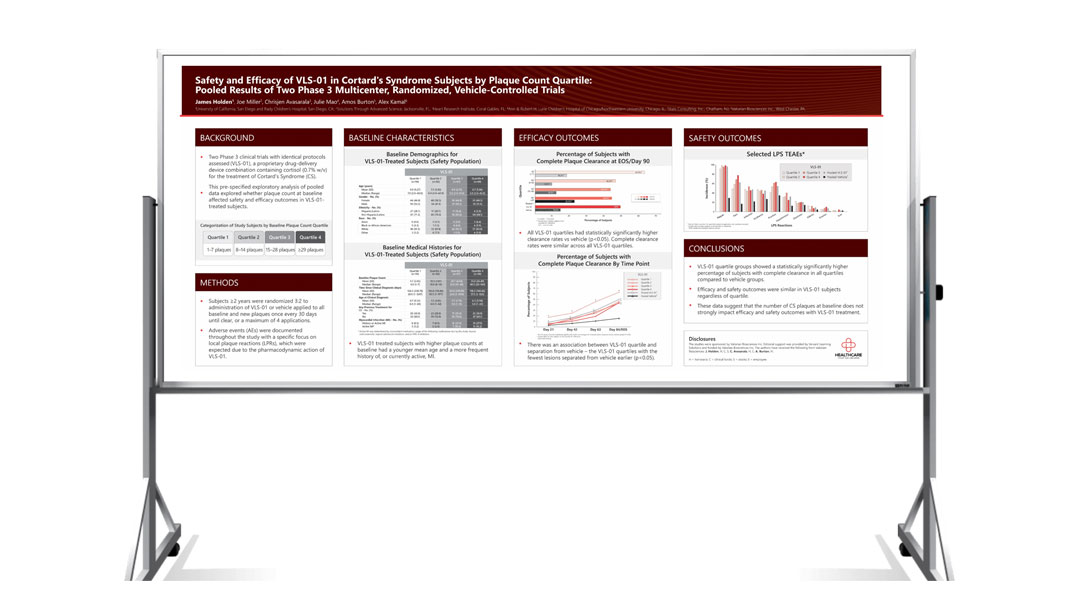
Overall Training Challenge: This was the first time the client’s Phase 3 pivotal data was to be presented. It was also the biggest conference of the year in this therapeutic space. The client wanted the data to speak for...


